Introduction
Data-driven decision-making is paramount to business success, the ability to extract actionable insights from transaction data can significantly enhance a coffee shop's operational efficiency and strategic planning. This report delves into a comprehensive analysis of a coffee shop's sales data, employing advanced analytical techniques to uncover key trends, optimize operations, and inform business strategies.
In this analysis report I expect deliver a detailed examination of the data, highlighting high-revenue periods and top-performing products, coupled with practical recommendations for staff scheduling, inventory management, and targeted marketing. The integration of dynamic dashboards and interactive features, such as slicers for store locations, further enhances the usability and interpretability of the findings.
This report aims to empower the coffee shop with the insights needed to make informed decisions, optimize resources, and ultimately drive business growth.
The primary objectives of this project were to:
- Analyze transaction data to identify key trends and patterns in sales and transactions.
- Determine the performance of different product categories and individual products.
- Optimize operations by understanding peak transaction times and high revenue periods.
- Provide actionable insights to improve overall business efficiency and sales strategies.
This report aims to present detailed findings and advanced insights derived from the sales data of the coffee shop, enabling data driven decision making and strategic improvements.
Business Needs
The coffee shop required a detailed analysis of their sales data to:
- Enhance decision making processes with data driven insights.
- Optimize staff scheduling by identifying peak hours and busy days.
- Tailor inventory management based on the popularity of products.
- Develop targeted marketing strategies to boost sales during off peak times.
Methodology
To meet these needs, the project involved several key steps:
Data Preparation and Quality Assurance:
Creating PivotTables:
Visualization and Dashboard Development:
Conducted initial data profiling and quality checks to ensure accuracy and completeness. Added calculated fields for revenue, month, day of the week, and hour of the day. Ensured data consistency and removed any anomalies.
Generated PivotTables to summarize revenue by month, transactions by day of the week and hour, and transactions by product category. Sorted and filtered data to highlight the top 15 product types by the number of transactions and revenue.
Created PivotCharts to visually represent revenue trends by month, transaction patterns by day and hour, and product category performance. Assembled the charts into a cohesive dashboard layout for easy interpretation. Added slicers for store locations to enable dynamic filtering across all PivotTables.
Advanced Insights and Recommendations
1. Peak Transaction Times and Days:
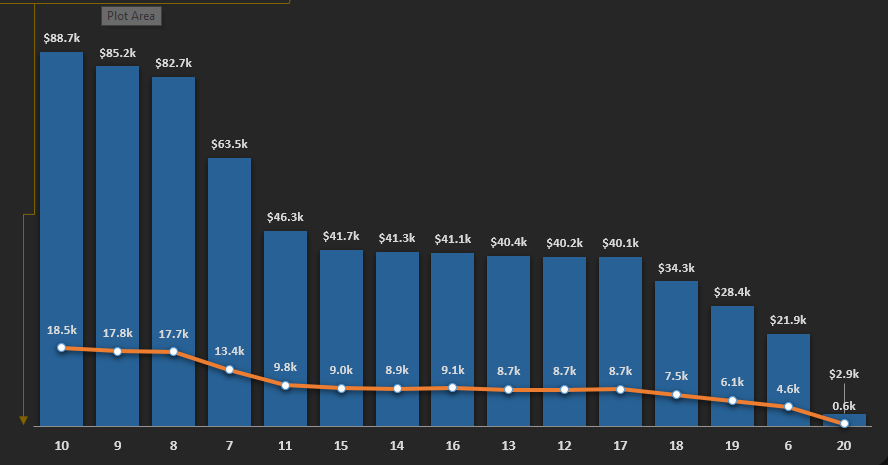
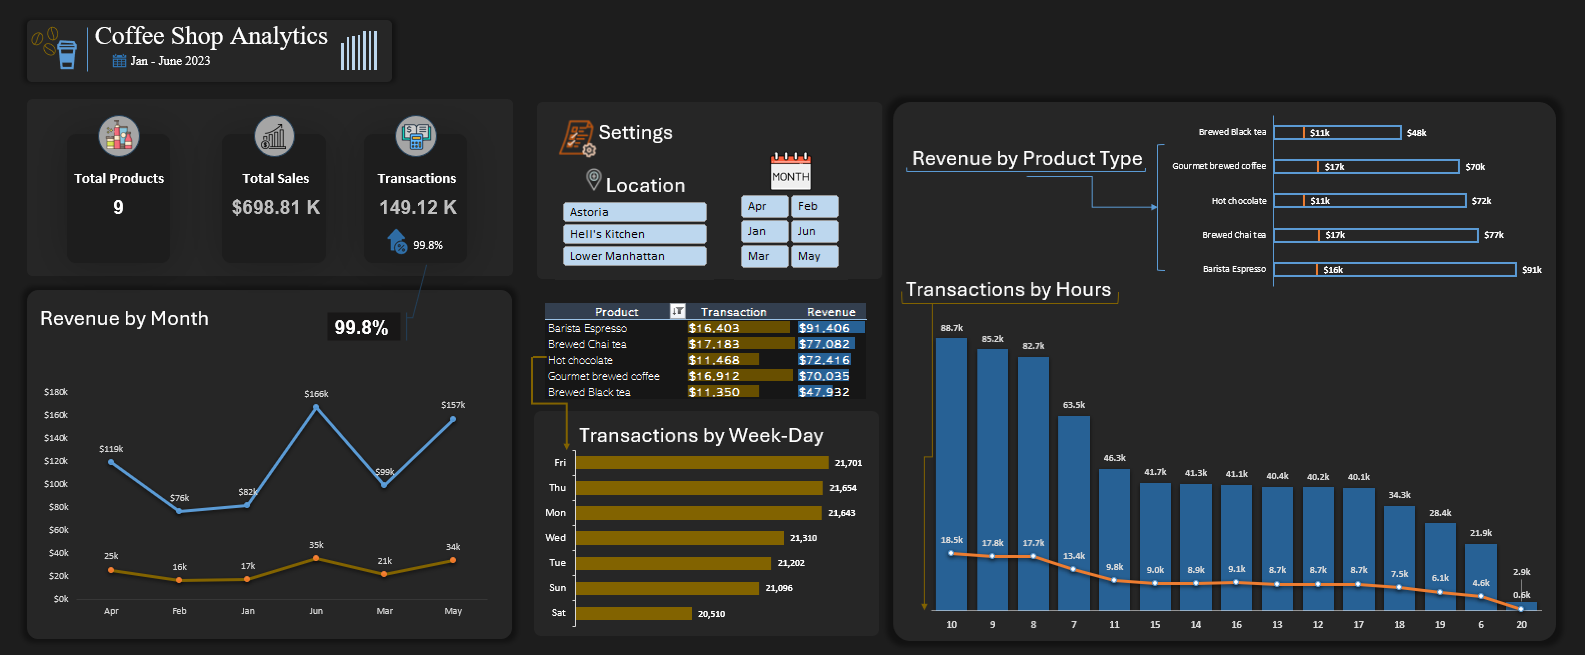
Revenue & Transactions by Hours
This chart offered a comprehensive analysis of the correlation between revenue, transaction volumes, and their respective hours throughout the day. By examining the hourly fluctuations, we can pinpoint specific times of the day that consistently drive the highest revenue, enabling more effective resource allocation and targeted marketing strategies.
The data revealed that peak transaction times are between 79 AM and 46 PM, with Fridays and Saturdays being the busiest days.
Recommendation:staffing during these peak periods to ensure efficient customer service and minimize wait times. Additionally, consider running special promotions or loyalty programs during these times to maximize sales.
2. High Performing Products and Categories:
Finding:The top performing products are espresso based beverages and breakfast items, particularly those with seasonal variations.
Recommendation:Focus on promoting these high margin items through targeted marketing campaigns. Additionally, consider expanding the seasonal menu to include more variations based on customer preferences and trends.
3. Off Peak Marketing Strategies:
Finding:Off peak times, typically midafternoon and late evenings on weekdays, show lower transaction volumes.
Recommendation:Develop and implement targeted marketing strategies such as happy hour discounts, combo offers, or loyalty points redemption during these periods to attract more customers and boost sales.
4. Inventory Management:
Finding:Certain products consistently show high demand, while others have lower turnover rates.
Recommendation:Tailor inventory management practices to ensure that high demand products are always in stock, while reducing the inventory levels of slow moving items to minimize waste and optimize stock levels.
Future Steps
To build on the insights gained from this analysis, the following steps are recommended:
1. Continuous Monitoring:
Implement ongoing data collection and analysis to continuously monitor sales trends and operational performance. Utilize real time dashboards for dynamic insights.2. Advanced Predictive Analytics:
Leverage advanced analytics techniques such as machine learning models to predict future sales trends, customer preferences, and potential operational bottlenecks.3. Customer Feedback Integration:
Incorporate customer feedback into the analysis to understand their preferences and satisfaction levels, allowing for more personalized marketing and product offerings.4. Cross Channel Analysis:
Analyze sales data across different sales channels, including instore, online orders, and delivery services, to gain a comprehensive view of customer behavior and preferences.Conclusion
By leveraging Excel's powerful data analysis and visualization capabilities, this project provided the coffee shop with a comprehensive overview of their sales and transaction performance. The insights and recommendations outlined in this report enable informed decision making, optimized operations, and strategic improvements, ultimately driving business growth and customer satisfaction.
Prepared by: James Ssekitoleko